
Home Deep Data Analysis: Turning Data Into Narrative Intelligence
Deep Data Analysis: Turning Data Into Narrative Intelligence
Databricks Solution Accelerator
Every organisation produces reports that matter, but the process is exhausting.
By the time it’s published, the story has changed.
Our accelerator fixes this by automating the pipeline from raw data → analysis → written narrative → publishable report.
It means:
Reporting becomes storytelling, not spreadsheeting.
Even with advanced BI, most strategic reports are crafted manually.
Each report demands hours of assembly and review, yet 80% of the content is reused every cycle.
Reporting isn’t broken. It’s just painfully repetitive.
When leadership asks, “Can we get a deep-dive version for the board?”,
it triggers a chain reaction of manual effort:
Every round introduces risk, inconsistent numbers, missed context, and outdated charts.
The Deep Data Analysis Accelerator automates this last mile, generating written reports directly from governed data and reusable templates.
Traditional BI ends at dashboards; decision-makers need stories.
Our accelerator bridges that gap.
It automatically:
The output reads like your best analyst wrote it, because it’s powered by them, distilled through AI.
Everything remains reproducible, traceable, and governed.
| Component | Role |
|---|---|
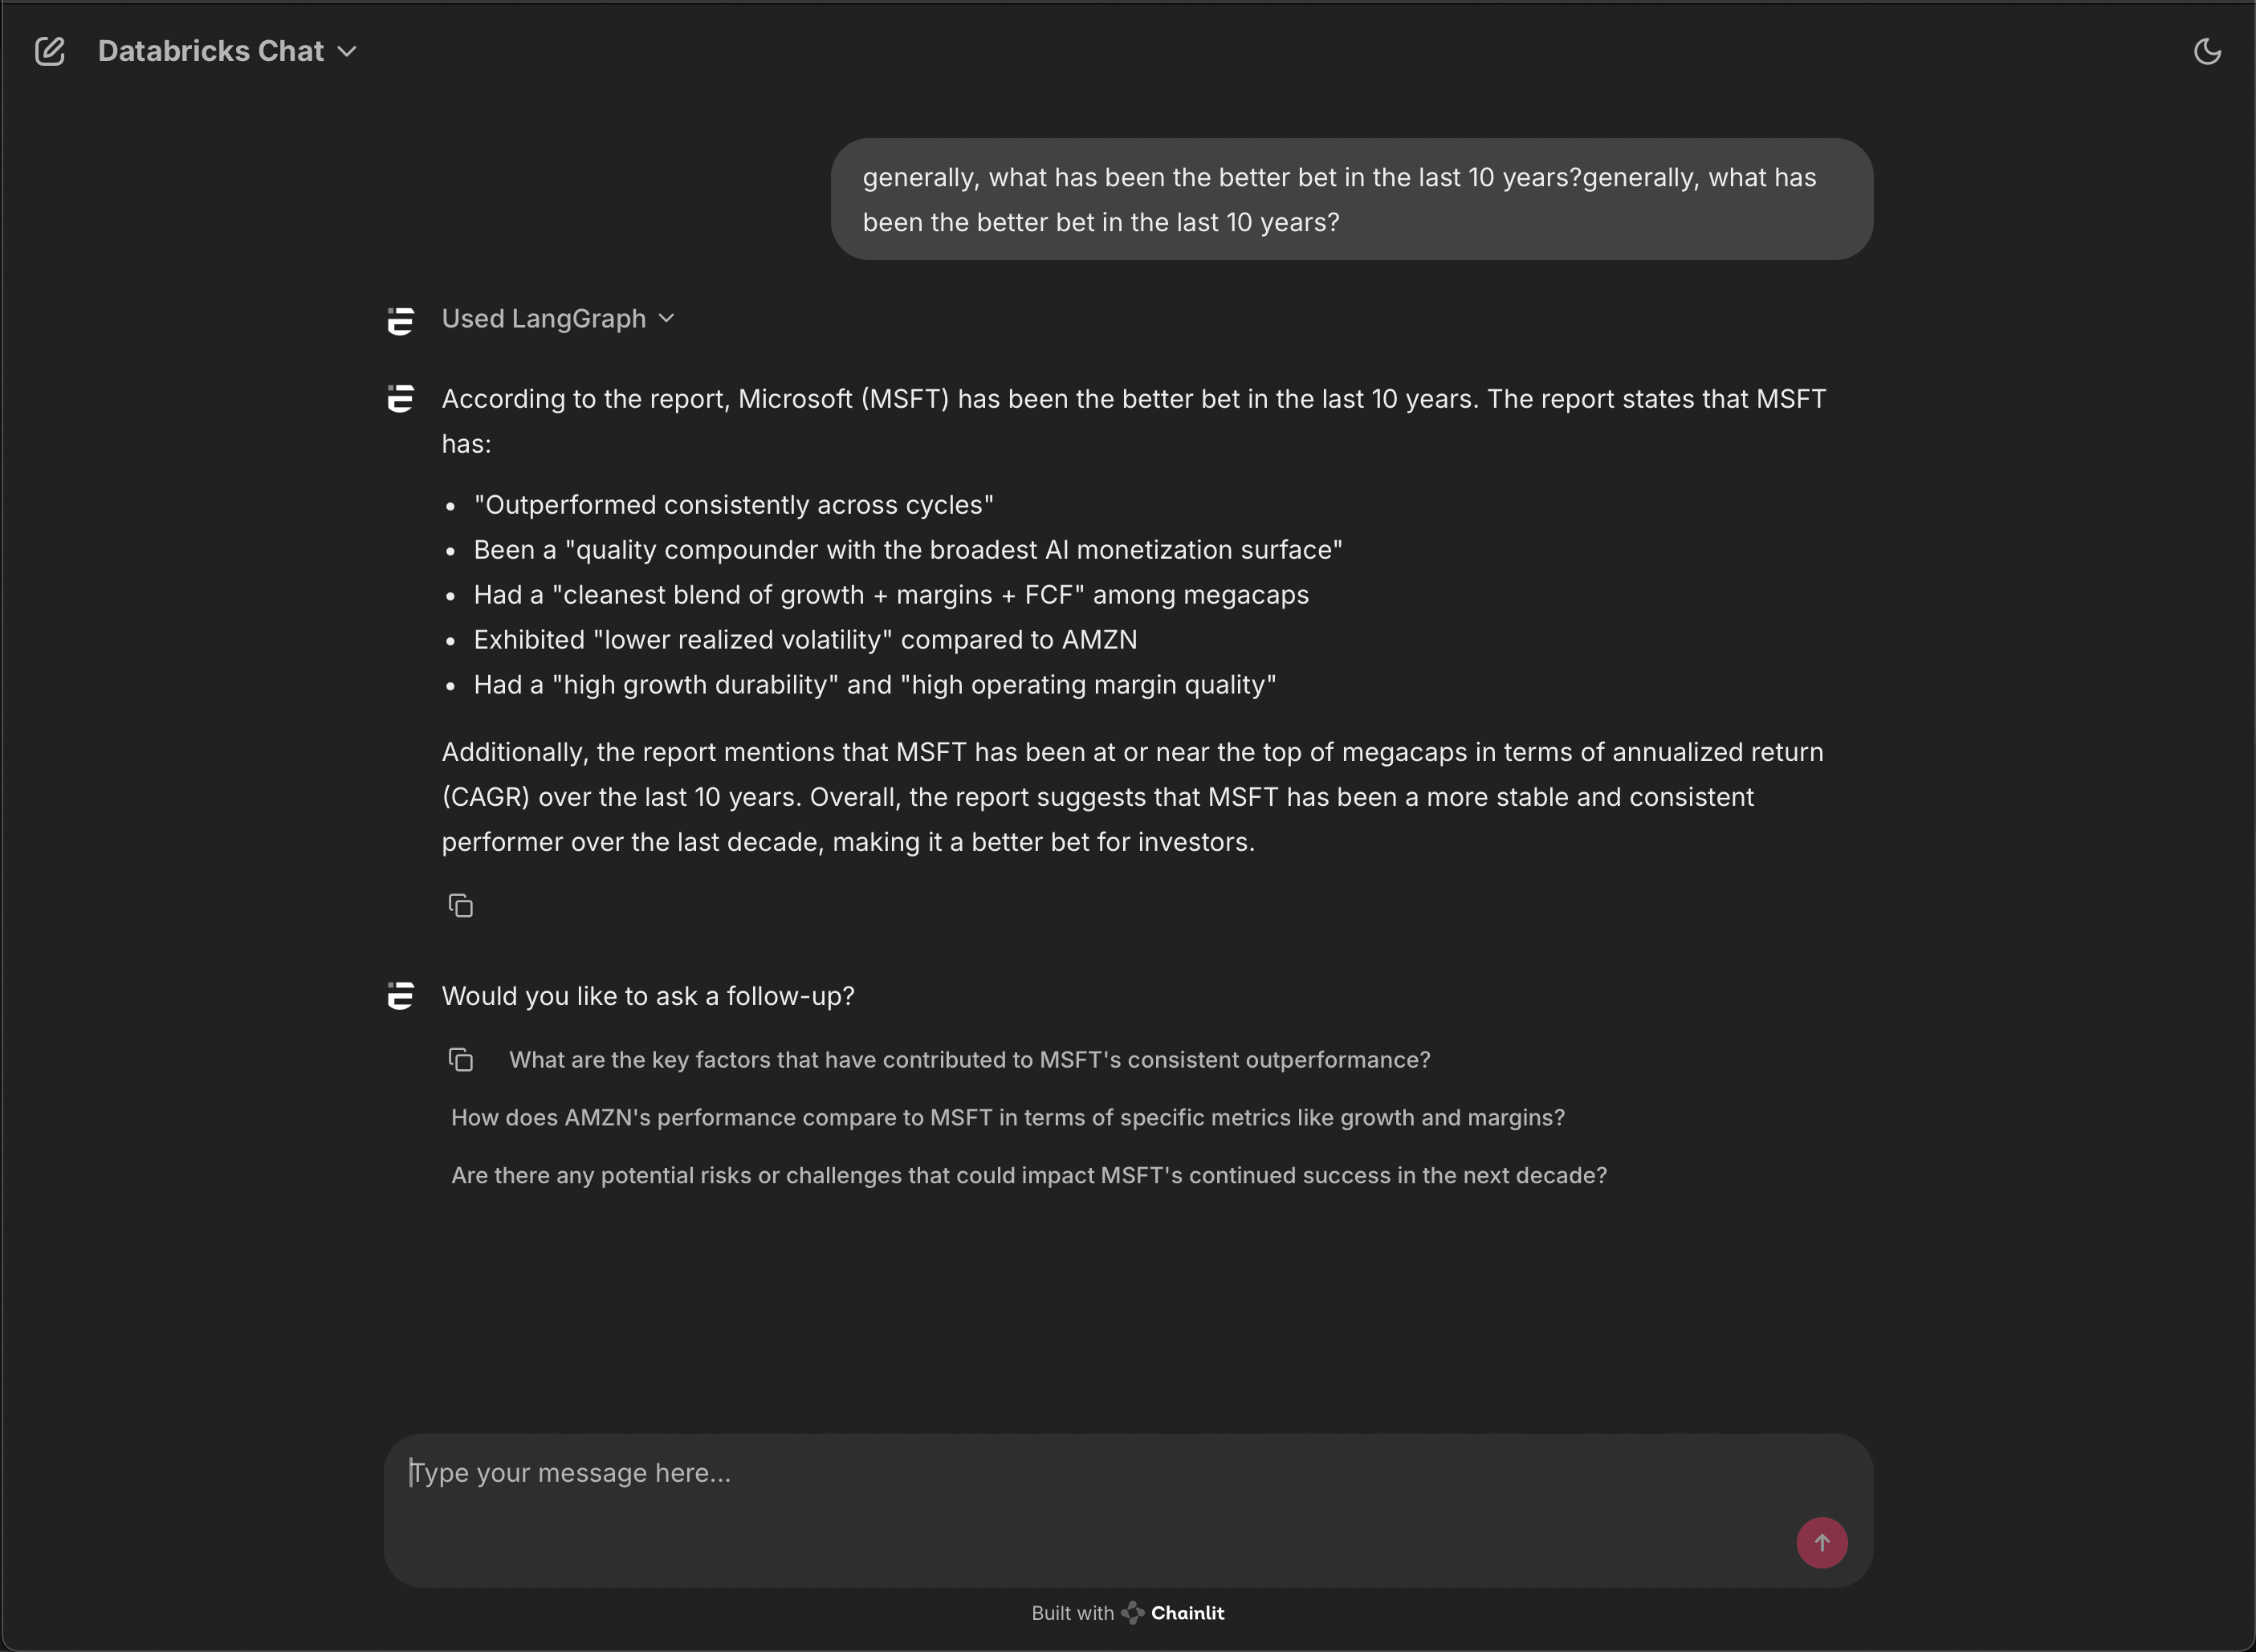
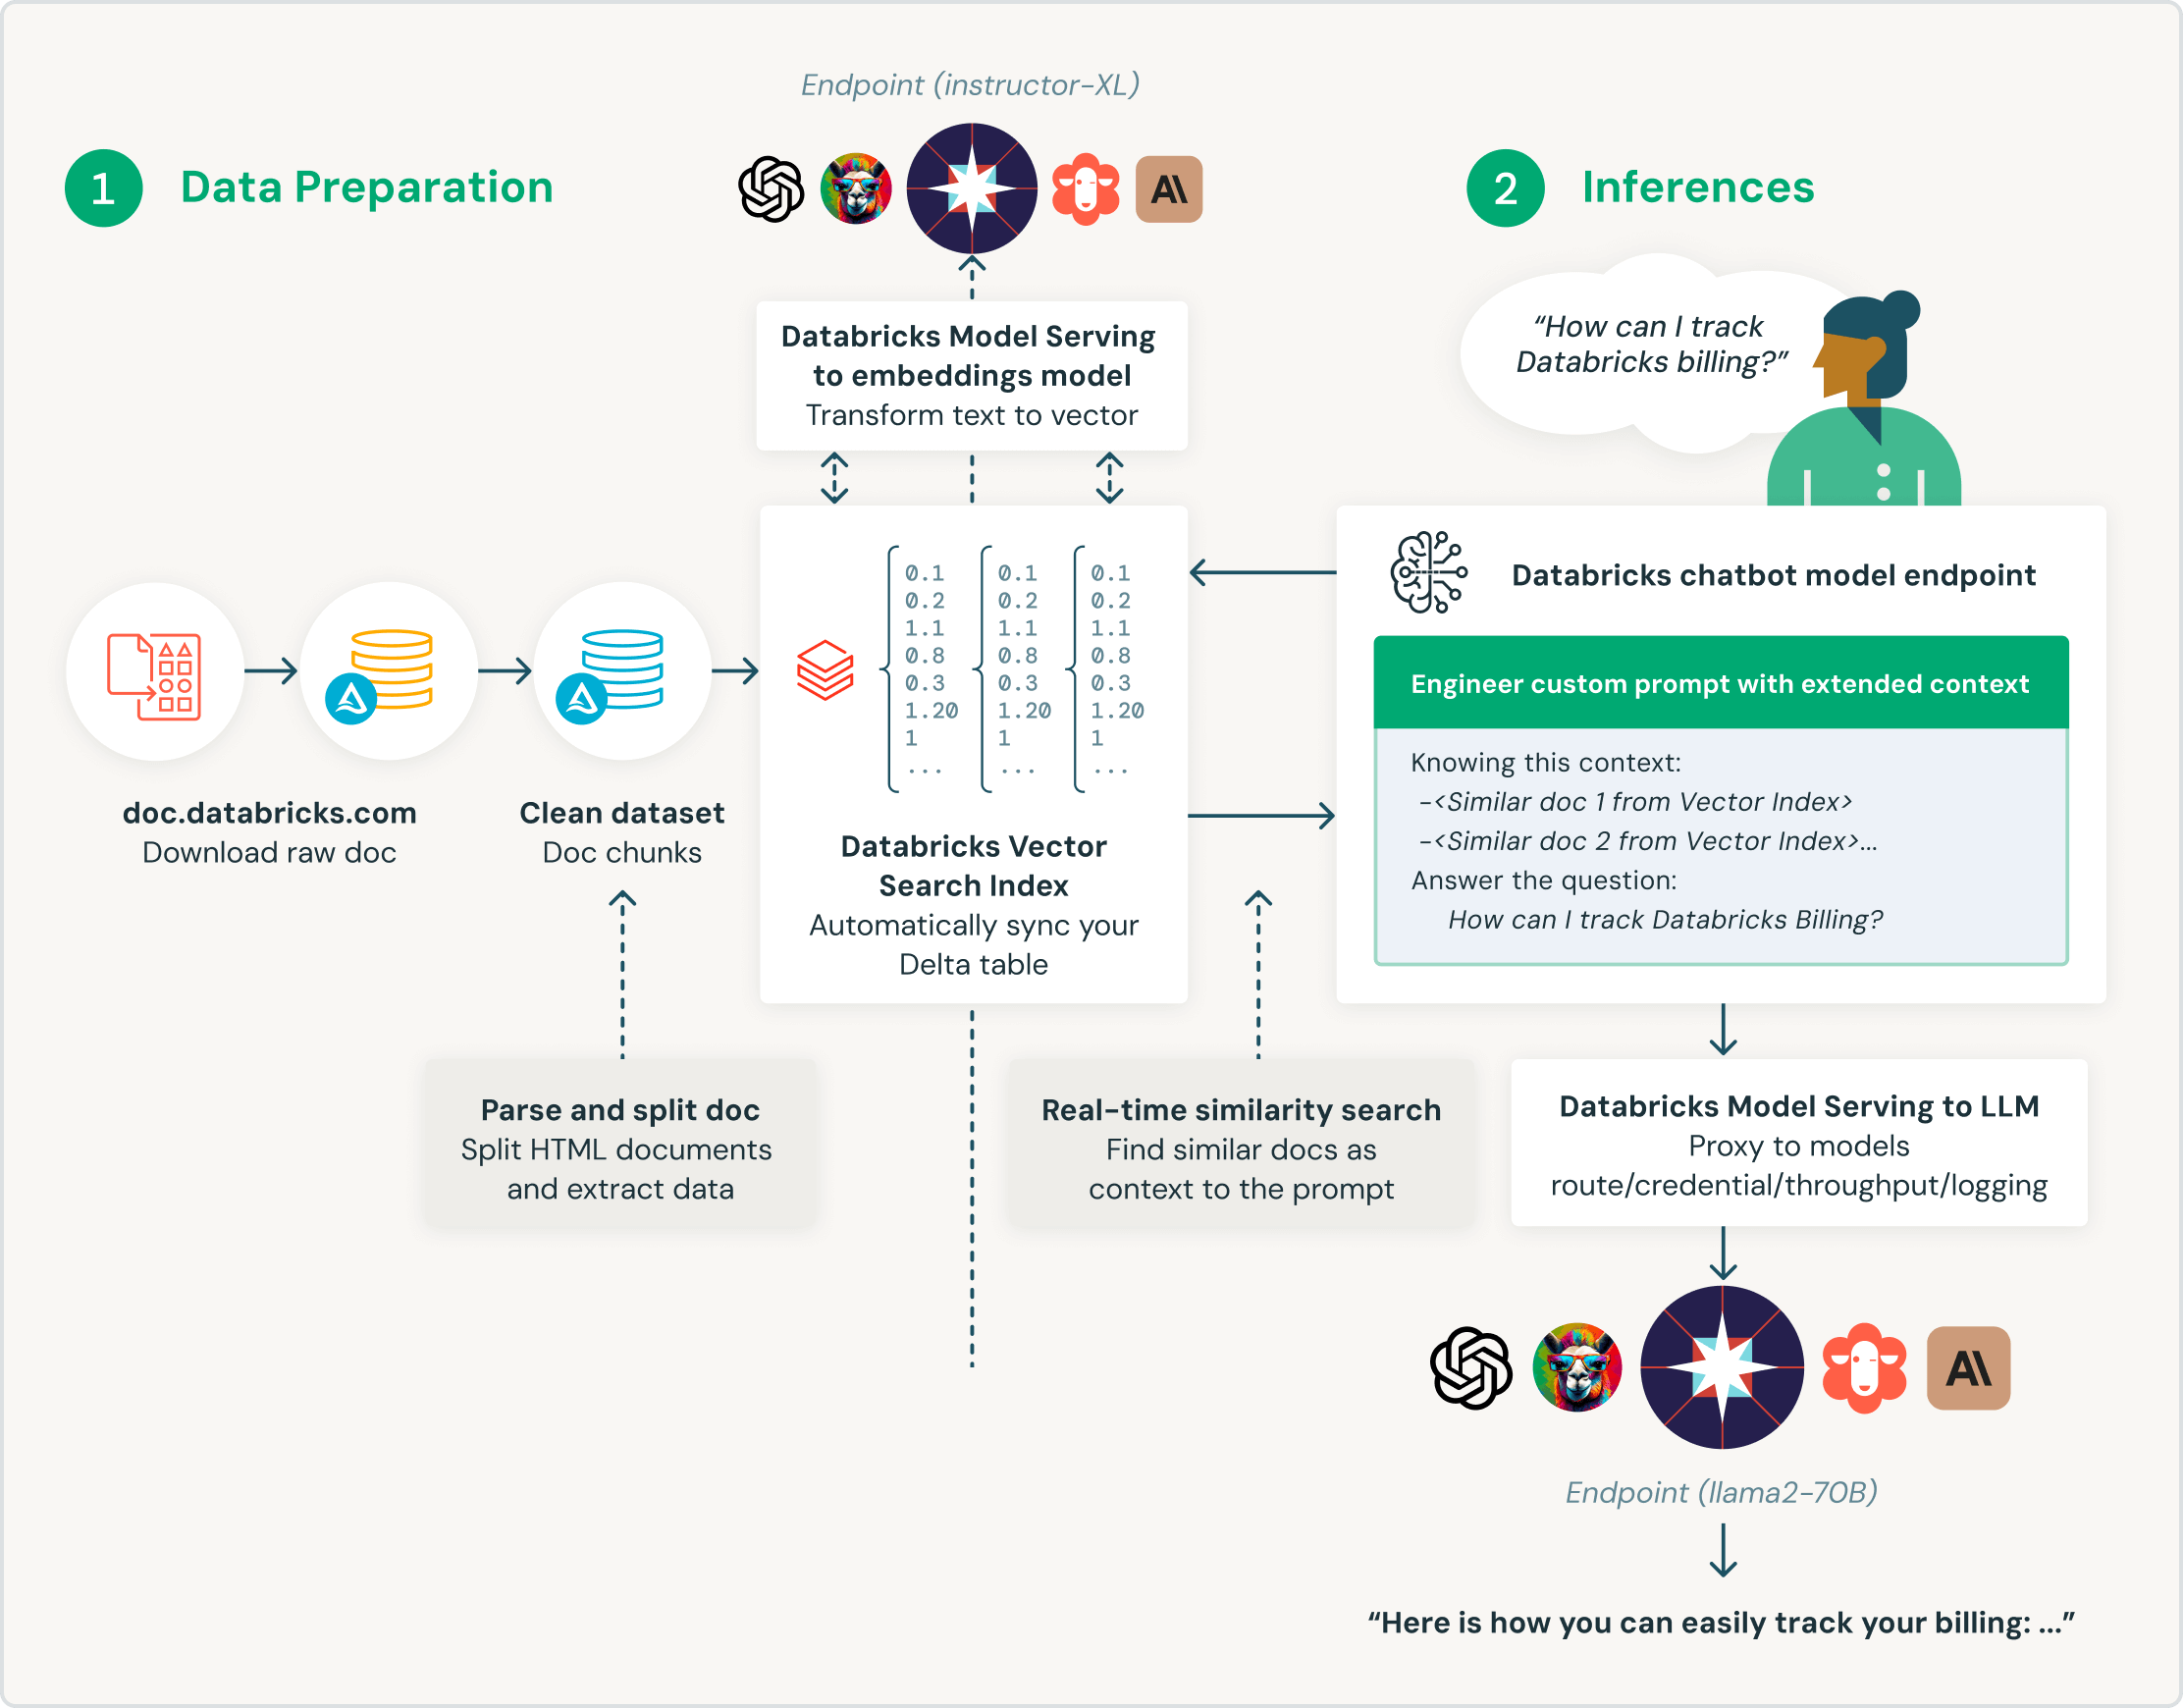
| Databricks Mosaic AI | Generates narrative insights from data models |
| AI Genie Agents | Automate report generation workflows |
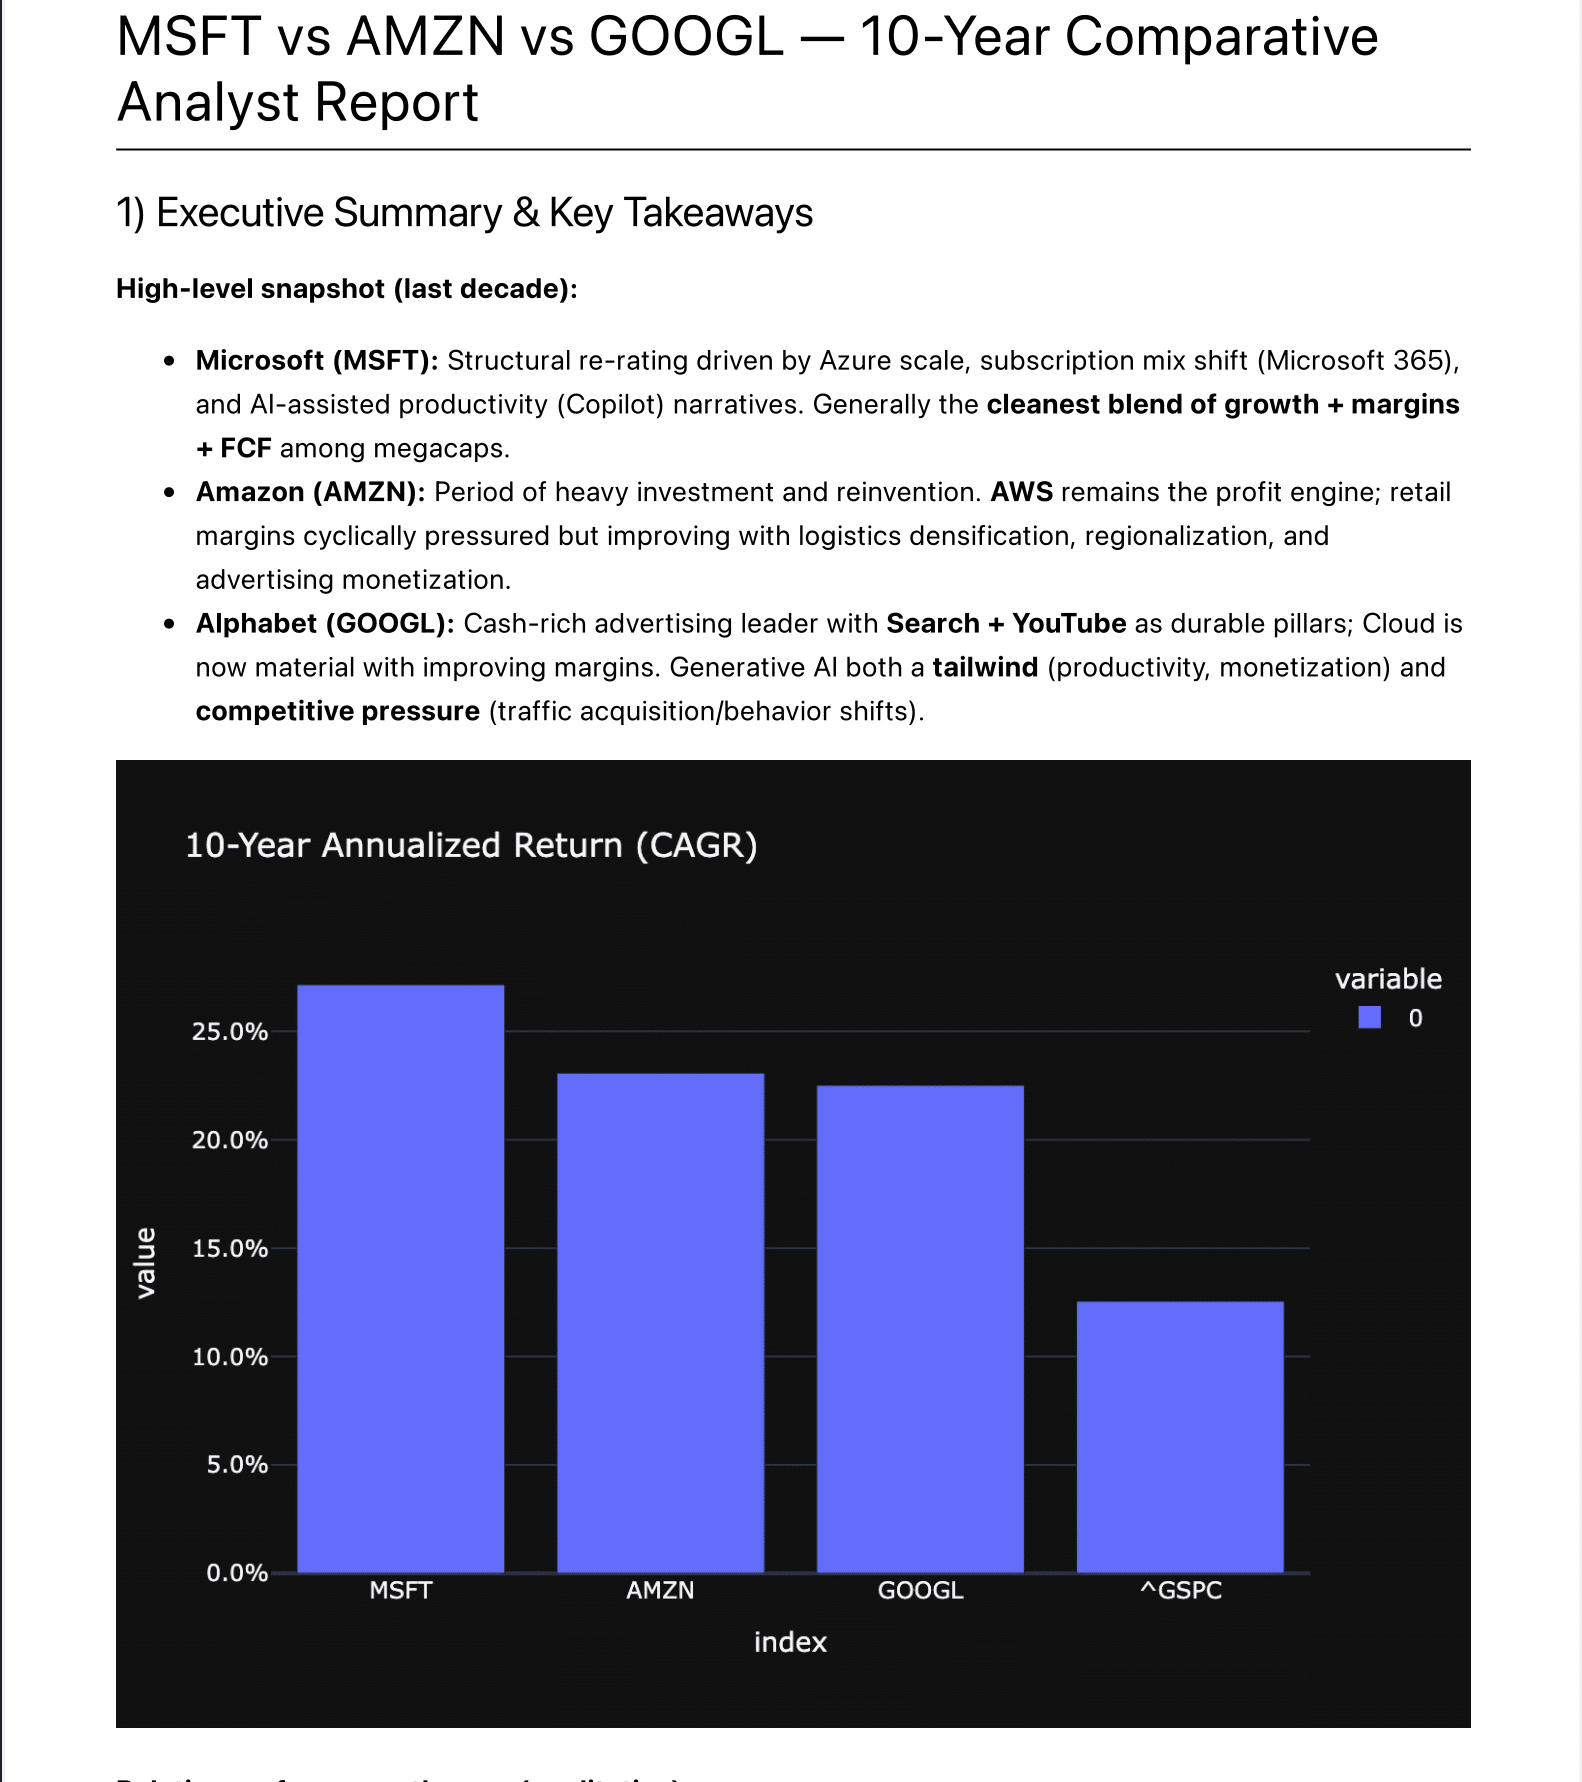
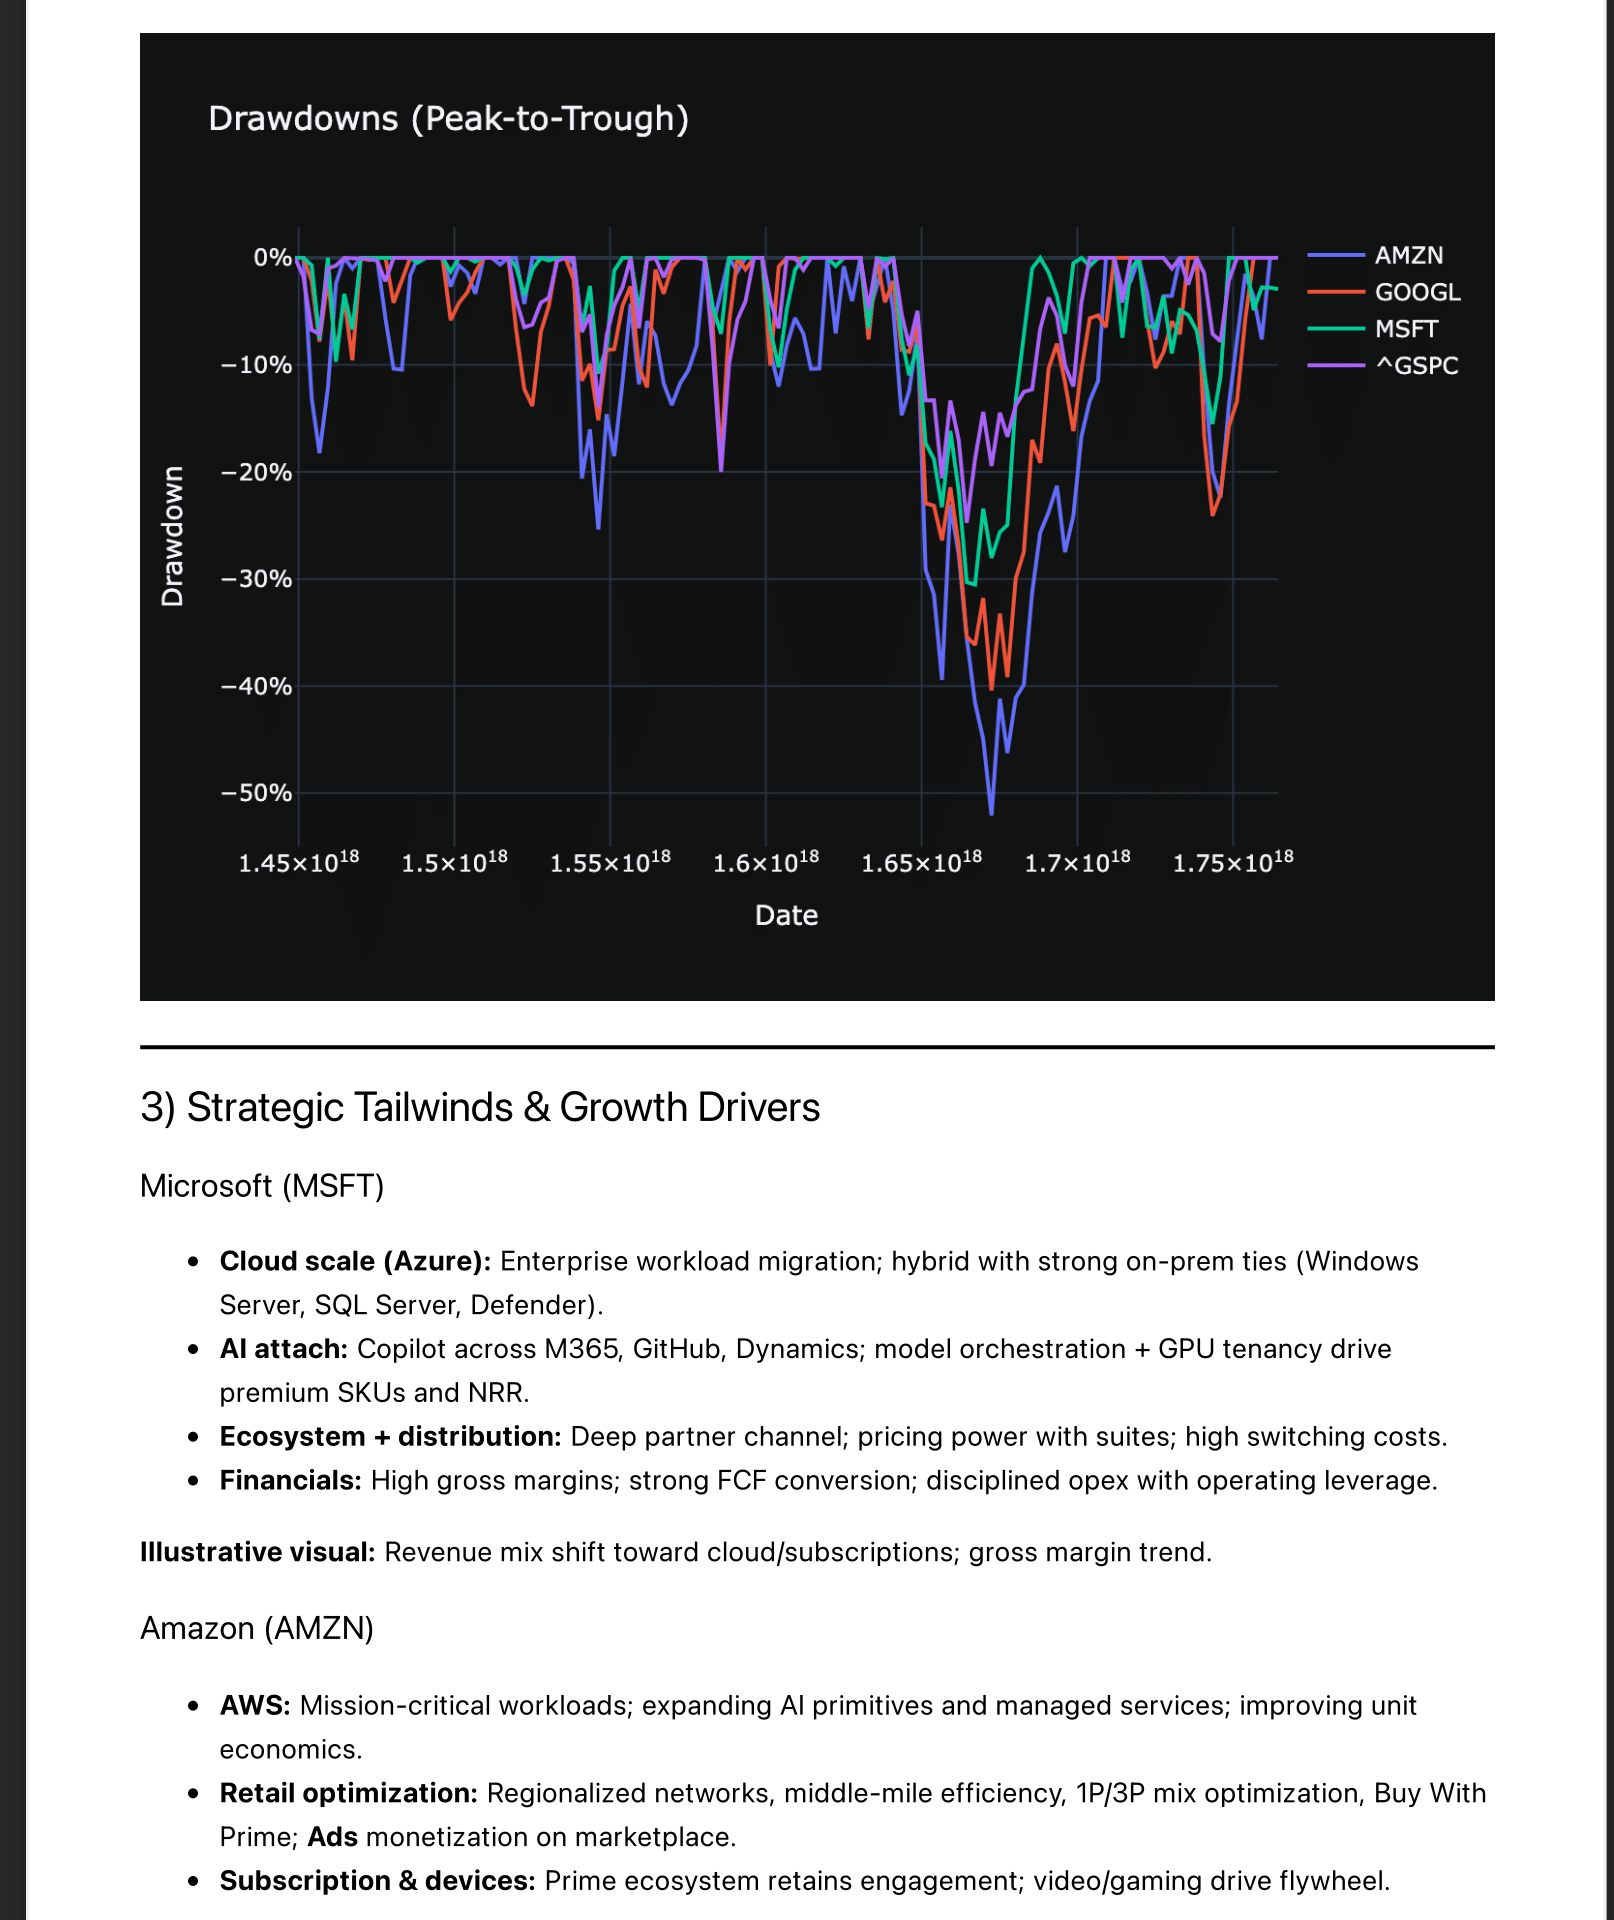
| Plotly | Produces interactive and publication-ready charts |
| Databricks Vector Search | Enables instant discovery across report archives |
| Azure Data Services | Provides ingestion, transformation, and scale |
| Unity Catalog | Maintains lineage, permissions, and governance |
Every paragraph, every number, every chart; sourced, and trusted.
Every report is born inside your existing compliance boundaries.
| Outcome | Impact |
|---|---|
| 80–90% reduction in manual report drafting time | From weeks to hours |
| Consistent reporting tone and structure | Fewer revision cycles |
| Enhanced trust in published figures | Single governed source |
| Instant discoverability of prior reports | Institutional knowledge unlocked |
Your next board pack could be written by lunchtime and will still be audit-ready.
Start Small. Scale Everywhere.
We typically deliver value in 2–6 weeks:
Each new report becomes faster, smarter, and more aligned.
With Elastacloud’s Deep Data Analysis Accelerator, reports write themselves –
grounded in truth, supported by data, beautifully visualised, and ready for the boardroom.