
To demonstrate this capability in Power BI, let’s develop a decision tree model working with Python within Power BI and a final dashboard with the achieved results. The machine learning model will predict the probability of customer churn as a function of other variables in our dataset.
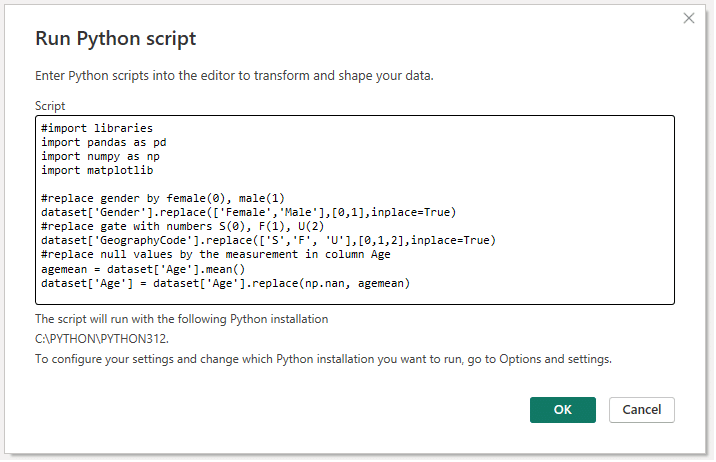
Data cleansing and data transformation are the most relevant steps to be taken when working with data. Python allows you to perform these transformations using popular python libraries like NumPy and pandas, just as we could do from Power BI. In this case, the steps will be developed in a Python script directly from Power BI.
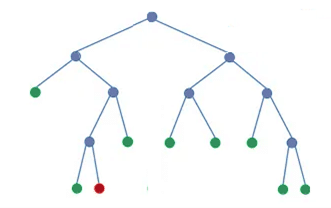
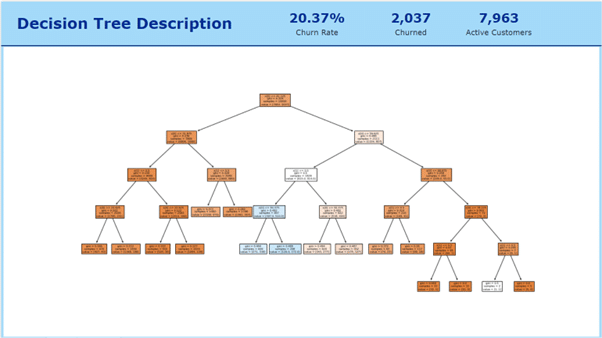
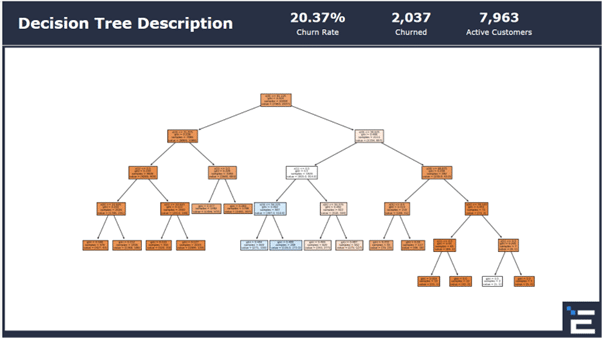
A Decision tree is a tree-like structure that represents a set of decisions and their outcomes, a pretty useful model when developing data analytics solutions. Each node in the tree represents a decision, and each branch represents an outcome of that decision. The leaves of the tree represent the final decisions or predictions.
The decision tree model will be deployed with scikit-learn library, which is a Python module for machine learning built on top of SciPy and is distributed under the 3-Clause BSD license.
The algorithm on which a decision tree works is a classification and regression algorithm in predictive modelling of both discrete and continuous attributes.
Predictions are based on the relationships between columns in a data set. The algorithm handles the values to make predictions based on achieving a particular outcome.
In addition, there are situations where the algorithm uses linear regression to determine where the decision tree splits.
There may even be a case where multiple columns are determined to be predictive, or the data has nested a table that is determined to be predictive, in which case, the algorithm will build independent decision trees for each predictive column.
The advantages of using decision trees are:
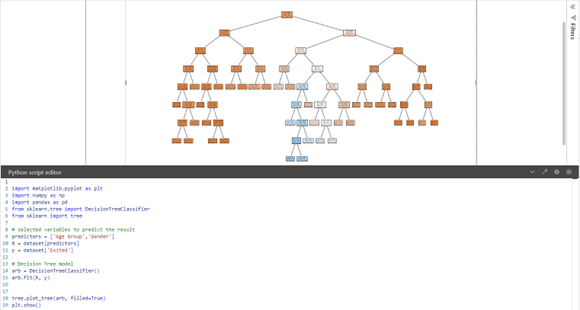
The use of Python for business analytics has led to this code, which allows to obtain a prediction on a decision tree to be able to operate later with the obtained results.
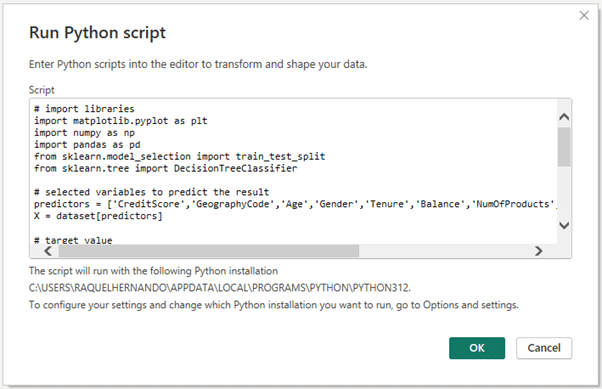
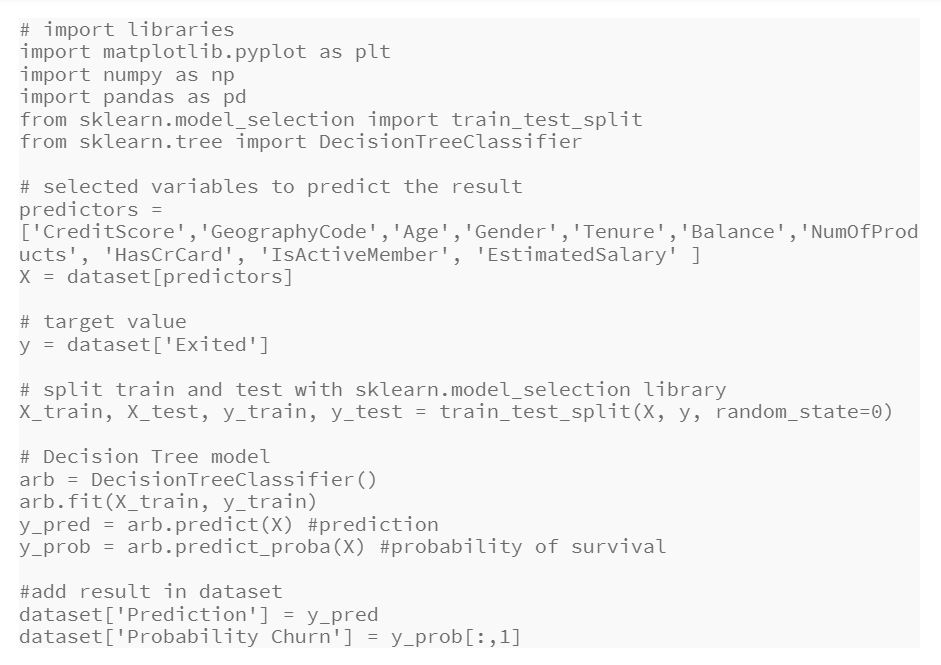
The decision tree model is very simple to interpret, and using Python also allows for the visualisation to be designed with predictor variables, to understand how the tree and its branches work. In this way, the code can be developed directly from Python as a visualisation.
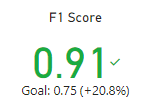
Now it is time to analyse the data obtained, and for this purpose, DAX is our best ally to assess the results. There are multiple metrics that would help determine the accuracy of the developed model. One of them is F1 Score.
F1 Score is very popular in machine learning analysis since it combines accuracy and recall scores. Although to understand this metric, we need to build the confusion matrix.
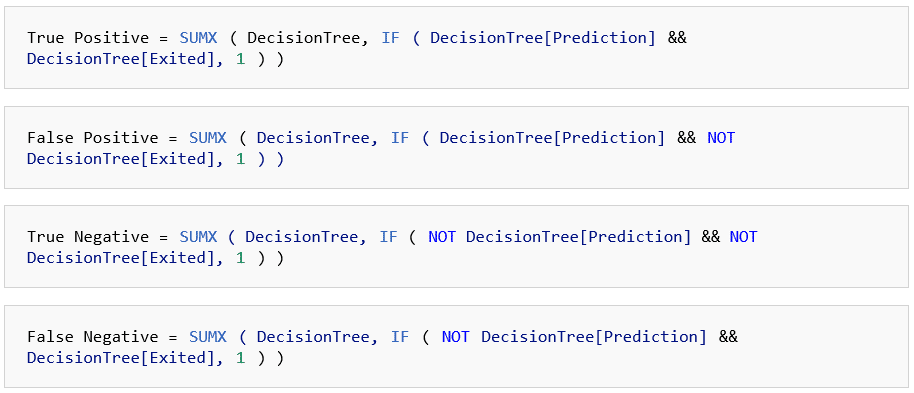
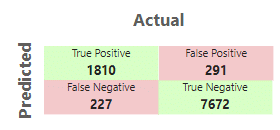
A confusion matrix is a representation of the predictive performance of a model, which has four essential elements:
To obtain these values, we can perform the following measures in DAX:
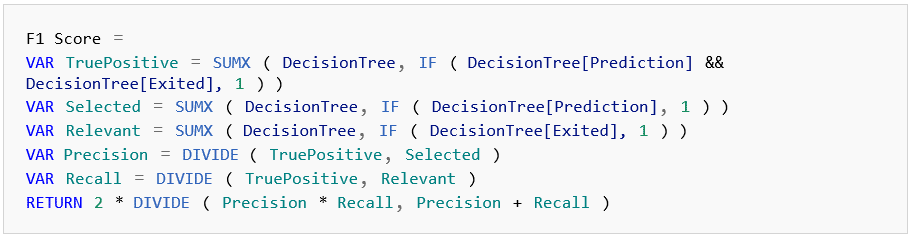
So now, using the elements which have been added to the confusion matrix, accuracy, and precision should be included to get F1 Score.
In a visualisation card, the result of the decision tree model that has been developed is shown. The prediction model shows that there is an accuracy score of 91 percent.
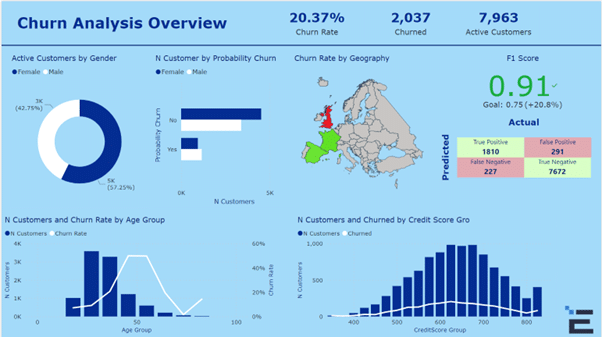
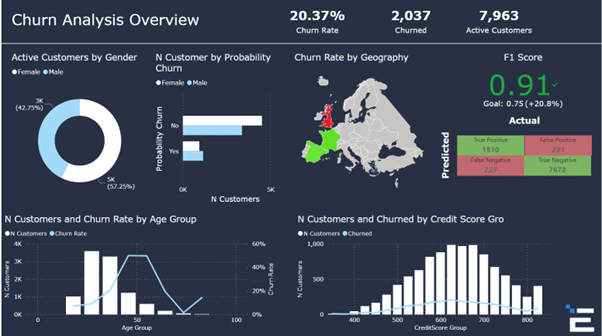
It is now time to analyse the data and create a dashboard with the most key information for decision making as shown here.
Or
The use of machine learning for data science can lead to new insights when it comes to analysing existing data and coming to new conclusions. Leveraging these technologies will definitely be of great value for any business out there trying to make a more effective use of its data.